v2.8 [Apr 6, 2008] Intelligent Import, Speedup of file operations
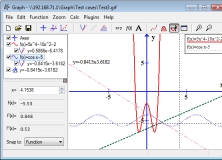
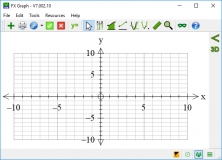
It can be used to draw mathematical graphs in a coordinate system.
Present your data in 2D/3D graphs and perform statistical analysis.
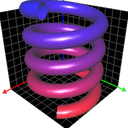
Graph Cartesians, polars, parametrics, slope fields, volumes of rotation.
Plot math equations and scatter points using equations and data points.
Performs regression analysis to estimate values of parameters.