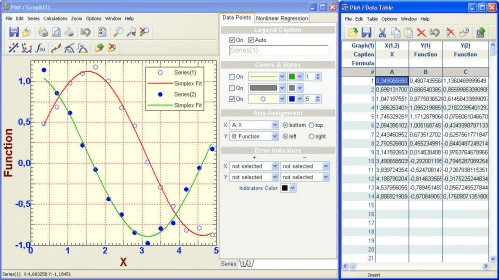
Rt-Plot is a tool to generate Cartesian X/Y-plots from scientific data. You can enter and calculate tabular data. View the changing graphs, including linear and non linear regression, interpolation, differentiation and integration, during entering. Rt-Plot enables you to create plots fast and easily. The line calculations give full access to calculation and display ranges and can use statistical weights. The options can be changed interactively. A powerful reporting module generates ready to publish documents. The result on the screen is the same as on the report printout (what you see is what you get). Although the program looks simple, the graph can be altered in any item you can imagine. All distances in axis, scaling, numberings, captions colors, line- and point styles and colors can be altered. Thus a plot can be generated fitting the requirements of any journal you want to publish in and of cause your personal taste. Features: unlimited number of data points, live calculated data points in data table, unlimited number of graphs, unlimited number of series in graph, unlimited number of calculated lines, linear regression, polynomial, non linear regression,interpolation, smoothing, differential, integral, calculations can use statistical weights, error indicators at data points, function interpreter for calculating columns and non linear functions, graph fully customizable, secondary axis at top and right, twisted, log, exponential axis scaling, all distances colors styles can be varied, report fully customizable, built in word processor, including graph and results.


Comments